Analysing medical research data
Select Lesson
Exam Board
Select an option
Biology practicals
Investigating specimens using microscopes
Investigating the effect of antimicrobials
Investigating osmosis in potatoes
Investigating the effect of pH on amylase activity
Investigating molecules in food using food tests
Investigating limiting factors of photosynthesis
Investigating human reaction times
Investigating seed growth under different conditions
Using field-work techniques
Investigating the effect of temperature on decay
Ecology
Ecosystems, competition and environmental changes
Adaptations and extremophiles
Food chains and predator-prey graphs
The water cycle
The carbon cycle
Decomposition and biogas
Human impacts on biodiversity
Global warming and its consequences
Conservation and maintaining biodiversity
Trophic levels and biomass transfer
Food security and biotechnology
Inheritance, variation and evolution
DNA: structure, genes and chromosomes
Protein synthesis - Higher
Proteins and mutations
Meiosis, sexual and asexual reproduction
Sexual and asexual reproduction
Inheritance and genetic diagrams
Inherited disorders
Types and sources of variation
Evolution by natural selection
Evolution: Darwin, Lamarck and Wallace
Antibiotic resistance: causes and prevention
Selective breeding
Uses and evaluation of genetic engineering
The process of genetic engineering - Higher
Cloning in plants and animals
Fossils as evidence for evolution
The theory of speciation
Classifying living organisms
Homeostasis and response
Homeostasis and blood glucose
The nervous system and the reflex arc
The structure of the brain
The eye: structure, reflexes and defects
Controlling body temperature
The human endocrine system
Hormones: adrenaline and thyroxine - Higher
The urinary system
Hormones in human reproduction
Treating infertility - Higher
Plant hormones
Bioenergetics
Infection and response
Organisation
Cell organisation
Enzymes
The enzymes of the digestive system
The respiratory system and breathing rate
Human circulatory system
Cardiovascular disease and treatment
The relationship between health and disease
Non-communicable diseases
Cancer and its risk factors
Plant cell organisation
Water and mineral transport in plants
Cell biology
Practical skills
Explainer Video
Summary
FAQs - Frequently Asked Questions
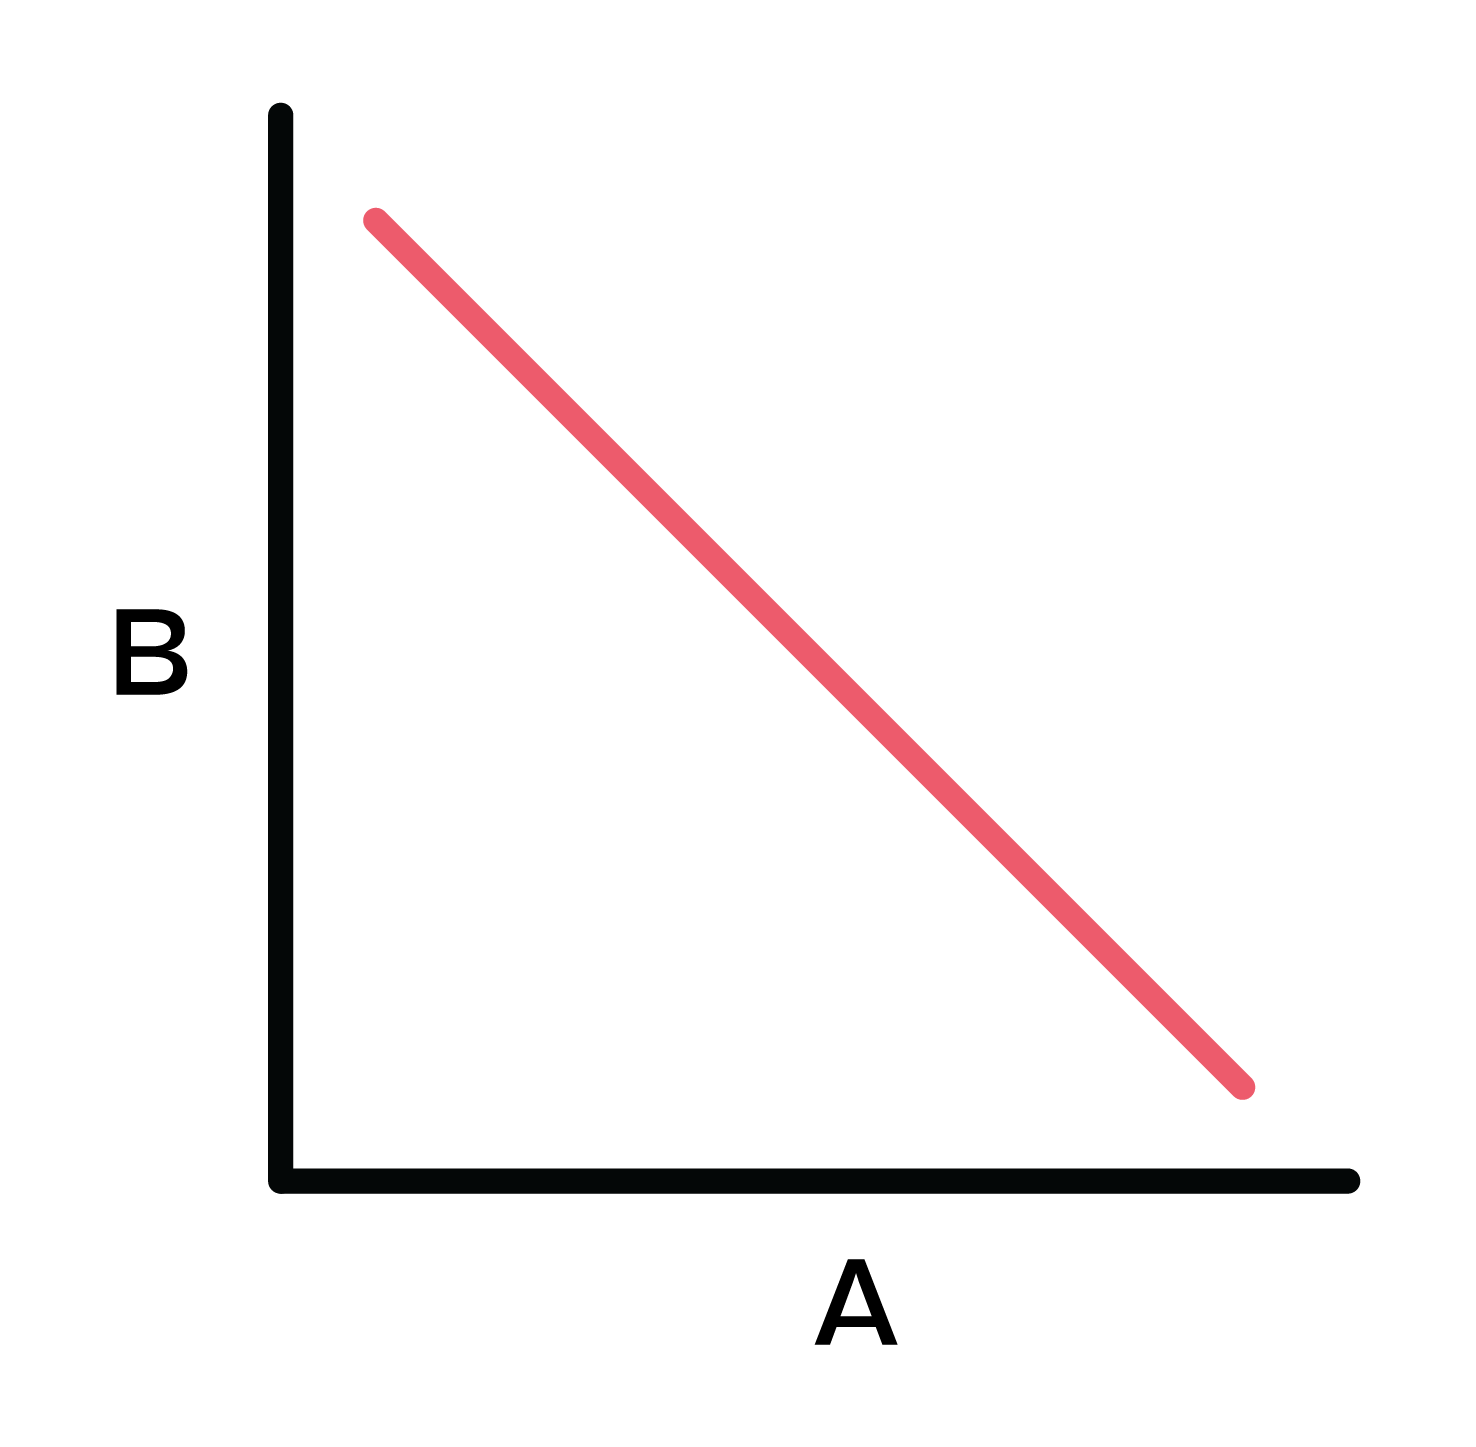
What is negative correlation?
If one variable increases as the other decreases, this is a negative correlation.
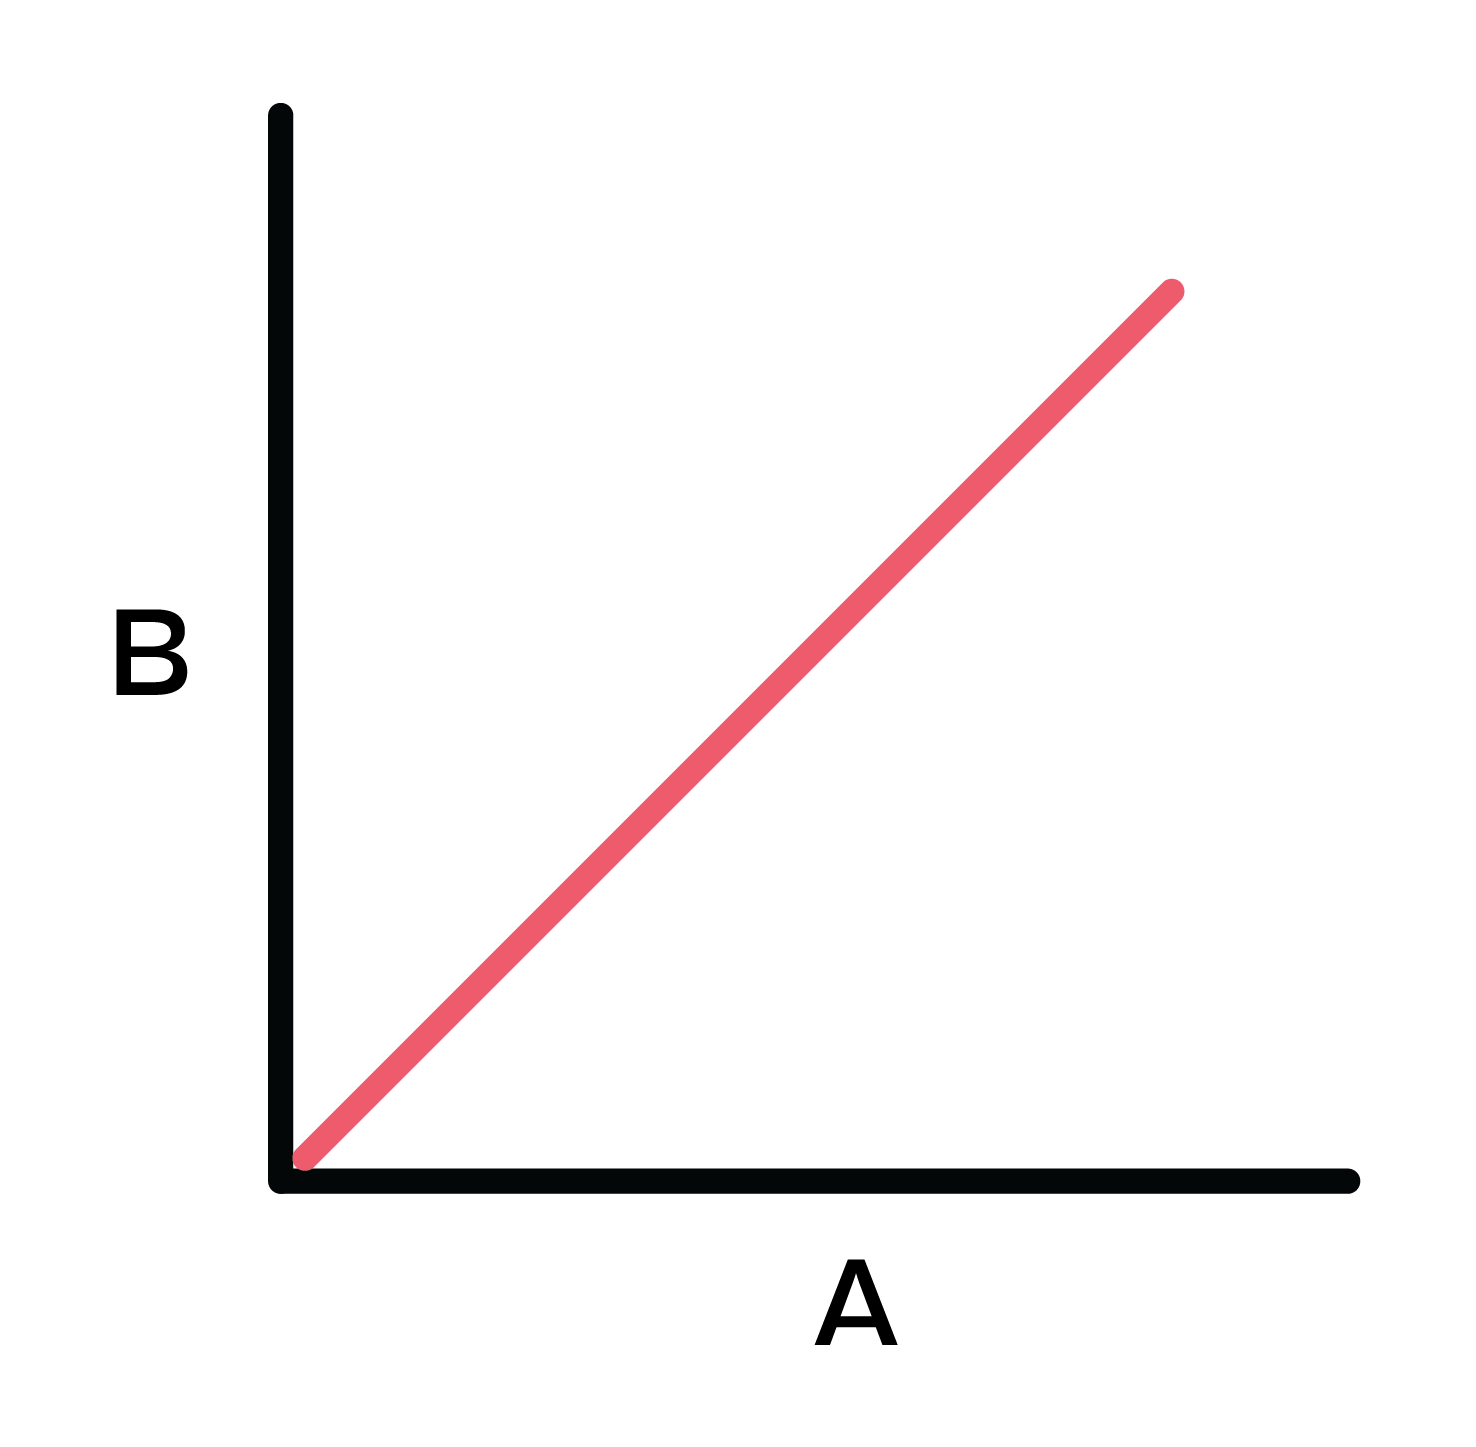
What is positive correlation?
If one variable increases as the other increases, this is a positive correlation.
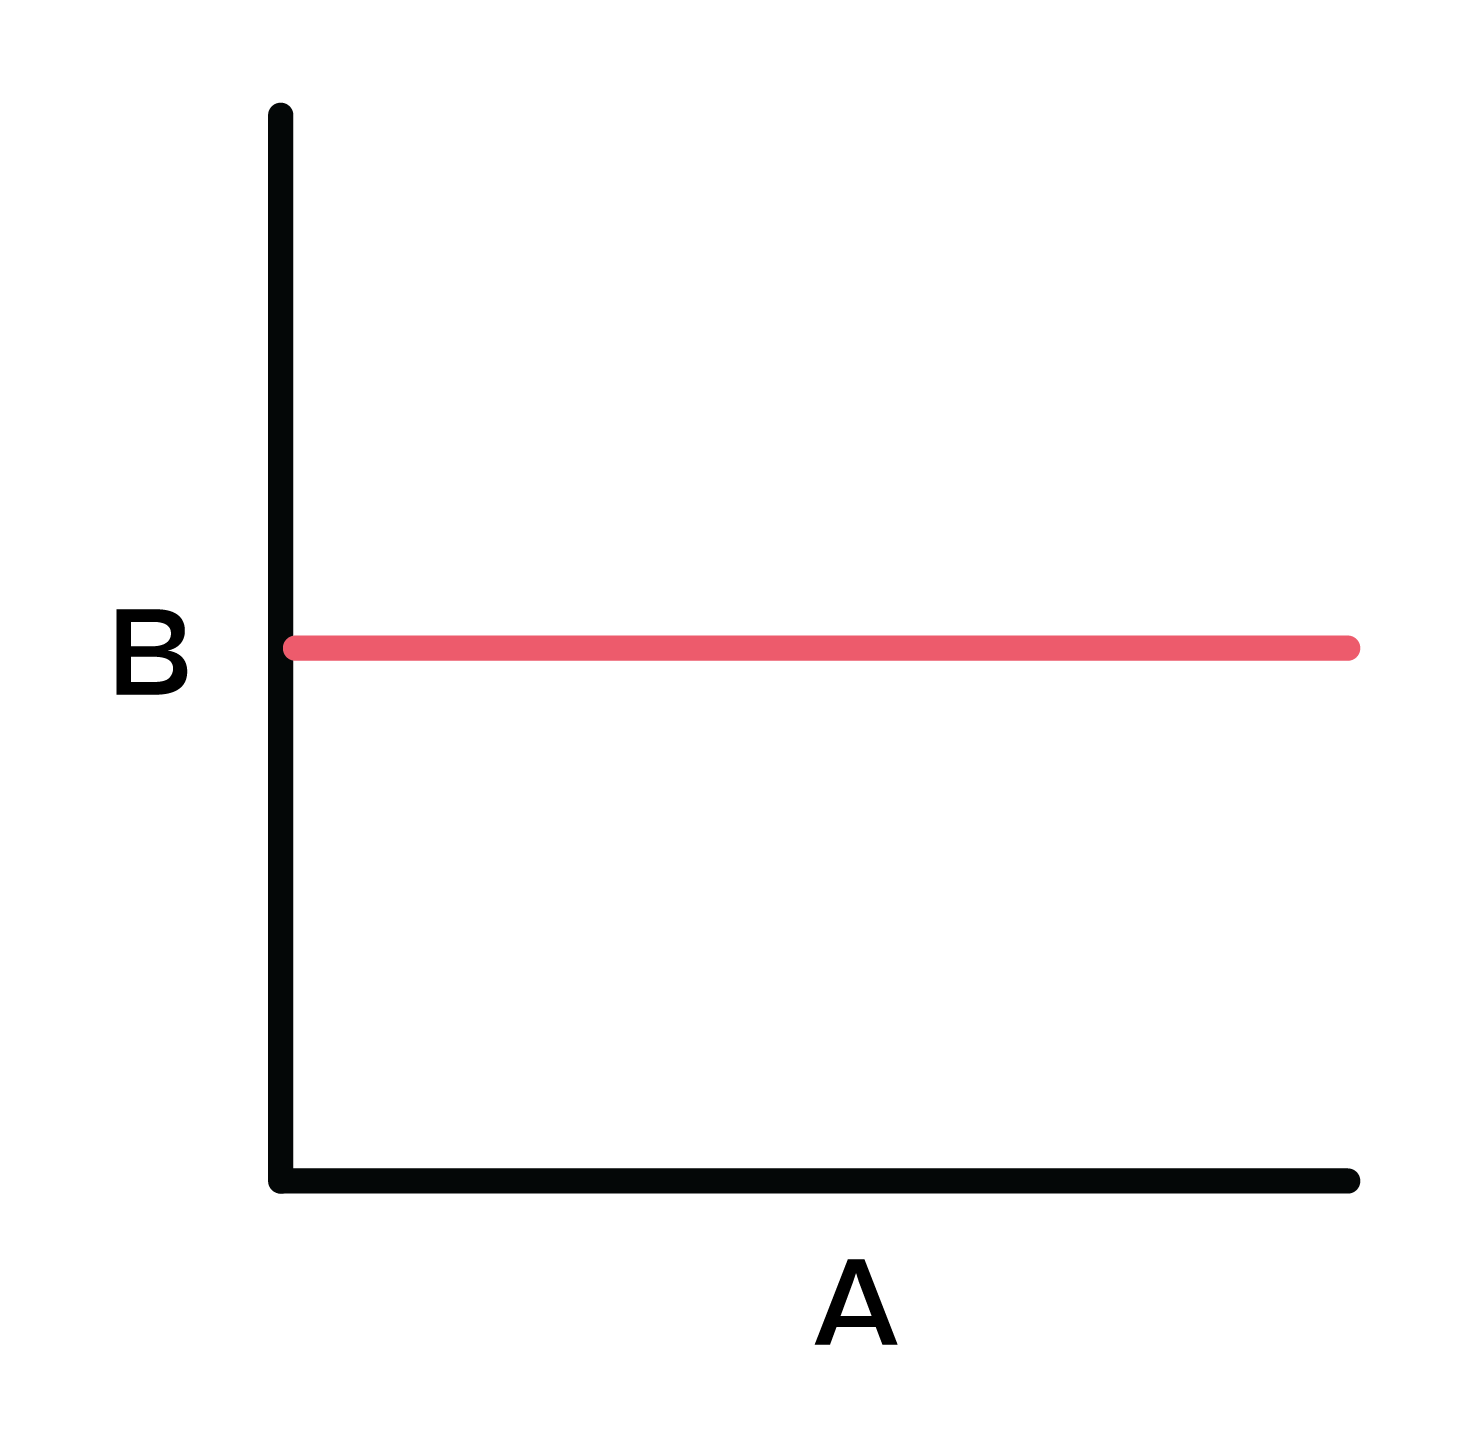
What is correlation?
A correlation is an association between two sets of random data.


